About
Introduction
Applications
Workshops
What's New?
Testimonials
Download
License
Learn
Training Materials
User Guide
Videos on YouTube
Citation Guidelines
Library
Courses
Modeling Tools
IBC: The Integrated Benefits Calculator
NEMO: The Next Energy Modeling system for Optimization
Community
Members List
Membership Statistics
Recommend Members
LEAP on Facebook
Discuss
LEAP Support
Announcements
LEAP en Español
General (non technical)
New Messages Only
Search
Search LEAP Site
Find Members
Sign Up
Log In
×
Requested page only available to members
×
Search LEAP Website
×
Login
Email:
Password:
Cookies are currently disabled:
Click here to enable
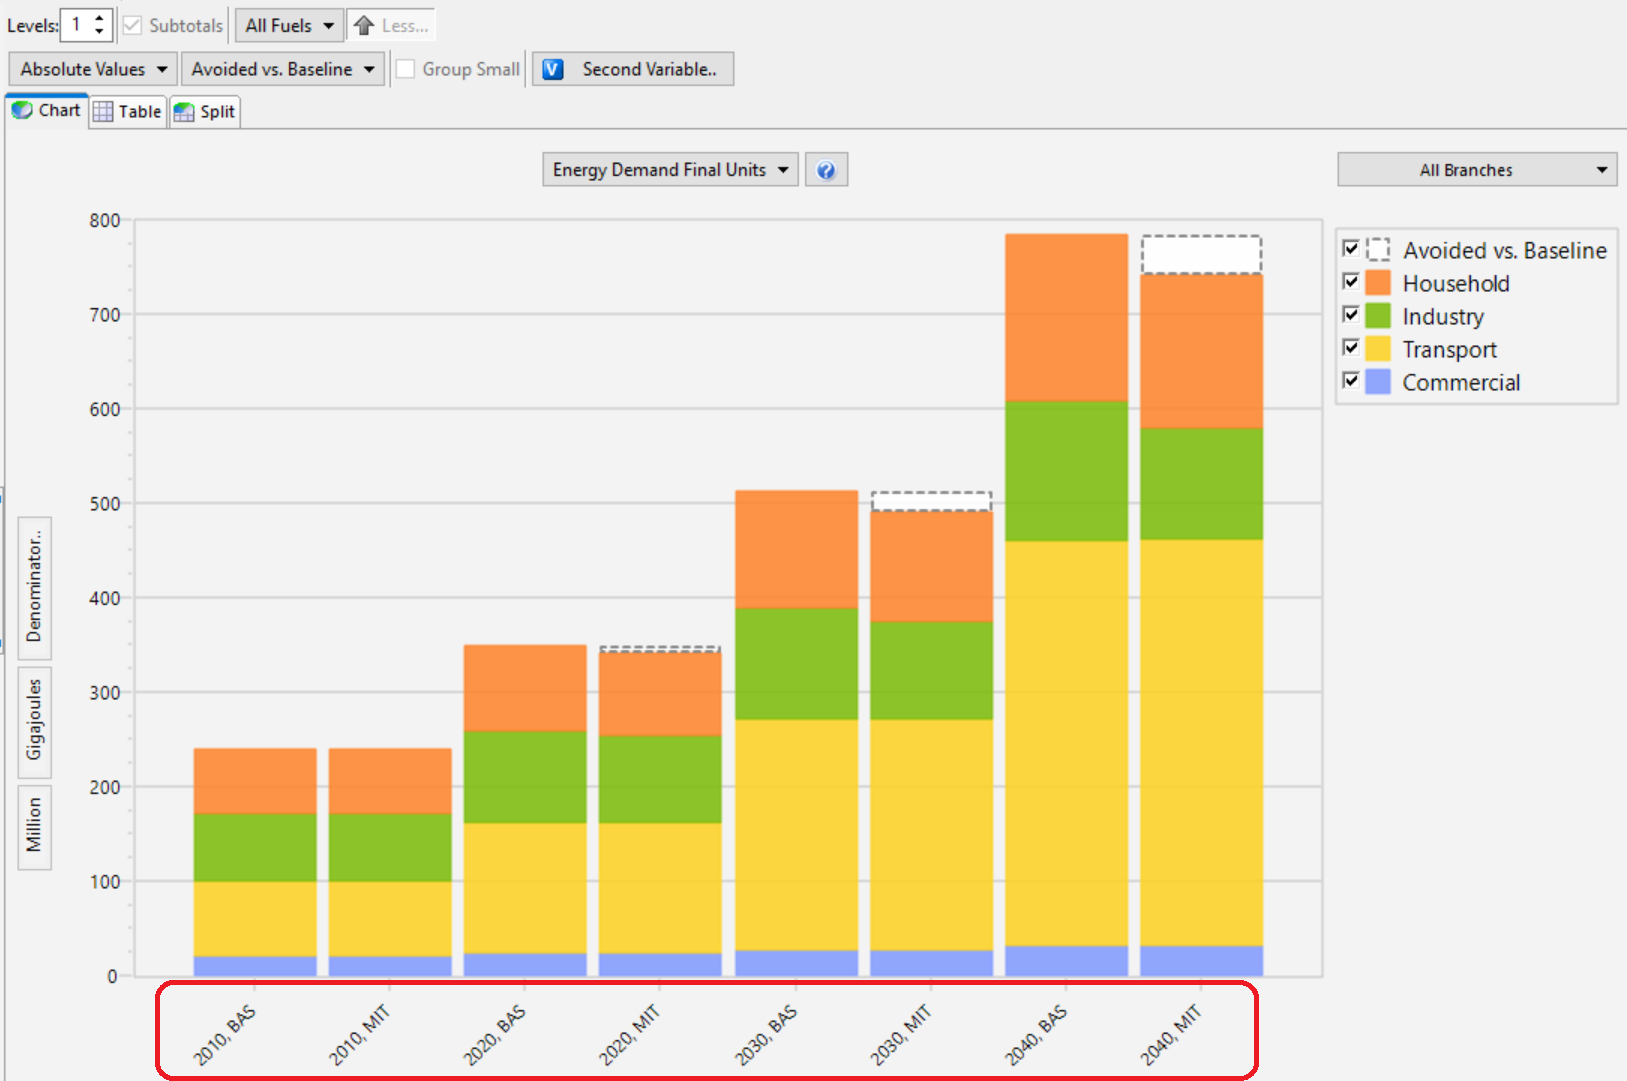
A Results View chart for energy demand showing years and two scenarios (baseline and mitigation) on the X axis (a composite dimension). It also plots the energy consumption avoided in the mitigation versus baseline scenarios.
Copyright © Stockholm Environment Institute
, 1982-2024, Language: English,
Citing LEAP
,
Privacy Policy